Measuring
infarct size by the tetrazolium method
James M. Downey, PhD
MSB 3024
University of South Alabama
Mobile AL 36688
Email: jdowney@southalabama.edu
Introduction
Myocardial infarction results from
myocardial ischemia and is a serious problem for the ischemic
patient because it compromises the ability of the heart to pump
blood through loss of contractile mass. Over the past 30 years
there has been a concerted effort in cardiology to identify
interventions which would make the heart more resistant to
infarction. While other surrogate end-points have been considered
such as enzyme release, recovery of post ischemic function or
indexes of viability in cultured cells, only actual measurement
of tissue necrosis can be relied upon to confirm a true
anti-infarct intervention. The key to such research is the
availability of a method which allows the early detection of
myocardial infarction in a whole heart. Tetrazolium staining has
emerged as the most popular method.
This technique relies on the ability of
dehydrogenase enzymes and cofactors in the tissue to react with
tetrazolium salts to form a formazan pigment. It can be argued
that tissue lacking either of these would not be able to survive
and is therefore dead or destined to die. On the other hand,
tissue that stains positively is not necessarily healthy and may
succumb hours or even days latter. For that reason, the longer
the reperfusion period after an ischemic insult, the more
reliable the method becomes for discriminating between dead and
viable tissue. Reperfusion times of less than 3 hrs (2 hrs for
crystalloid-perfused Langendorff hearts) are unreliable with this
method since insufficient washout time has occurred. Three days
of reperfusion is considered optimal. Unfortunately, the need for
a recovery model increases the complexity of a 3-day reperfusion
by an order of magnitude. For that reason, most investigators
settle on 3-6 hours of reperfusion for an open-chest study.
Beyond 3 days of reperfusion remodeling within the infarct again
makes the assessment unreliable due to scar shrinkage.
Ischemic myocardium is exquisitely
sensitive to temperature. It has been reported that cooling
salvages 7% of the risk zone per degree of cooling. Thus allowing
a rabbit heart to cool just 2 degrees to 35º C will reduce
average infarct size from 35% to 21% in untreated rabbits
undergoing a 30 min coronary branch occlusion. Inadequate
temperature control is a major source of noise in infarct size
studies.
Which tetrazolium should I use?
There are two popular forms of tetrazolium
available, nitro blue and triphenyl. The nitro blue tetrazolium
(Sigma catalog # N6876) will not cross membranes and therefore
can only be used with sliced tissue. The slicing disrupts enough
cells that the nitroblue will react with the exposed cytosol. The
triphenyltetrazolium (GFS Chemicals catalog # 597) will cross the cell membrane and for that reason
it can be used to both stain slices as well as be included in the
perfusate. A word of caution. If you want to perfuse a heart with
triphenyltetrazolium be aware that it is quite toxic and will
cause the heart to stop beating instantly. Therefore the heart
must be in a Langendorff apparatus where coronary perfusion will
persist even if the heart stops beating. It cannot be used in the
in situ heart. Triphenyltetrazolium (about $4/gram) also
has a definite price advantage over nitro blue (about $100/gram)
and is, therefore, the most popular form even with those who
slice their tissue.
Mixing the salts
The tetrazolium powder is diluted in a
phosphate buffer. We use a 2 part buffer system consisting of low
pH NaH2PO4 (0.1 M) and a high pH system
consisting of Na2HPO4 (0.1M). The Na2HPO4
has a molecular weight of 142 and is mixed up at 14.2 gm in a
liter of distilled water. The NaH2PO4 has a
molecular weight of 120 and is thus mixed at 12 gm in a liter of
distilled water. The table below shows the pH achieved with
different combinations of the two.
| pH |
Na2HPO4
High pH (%) |
NaH2PO4
Low pH (%) |
| 5.8 |
7.9 |
92.1 |
| 6.0 |
12.0 |
88.0 |
| 6.2 |
17.8 |
82.2 |
| 6.4 |
25.5 |
74.5 |
| 6.6 |
35.5 |
64.5 |
| 6.8 |
46.3 |
53.7 |
| 7.0 |
57.7 |
42.3 |
| 7.2 |
68.4 |
31.6 |
| 7.4 |
77.4 |
22.6 |
| 7.6 |
84.5 |
15.5 |
| 7.8 |
89.6 |
10.4 |
| 8.0 |
93.2 |
6.8 |
Use the pH 7.4 mixture (in bold). For
rabbit or rat hearts 40 ml of buffer is enough for a dog or pig
heart you will need 100 ml. Note that you will use about twice as
much of the high buffer as the low. For that reason we usually
mix 2L of high and 1L of low and keep them on the shelf as stock
solutions. The pH from the table is approximate so after mixing
you should check the pH with an accurate meter and adjust up or
down by adding either high or low buffer as needed until the pH
is exactly 7.4. Next we add tetrazolium salts at 1% weight/volume
(1gm/100ml). Thus, if one is mixing 40 ml of stain add 400 mg of
tetrazolium to 40 ml of buffer.
Slicing the heart
We prefer to stain heart slices rather than
perfusing the heart with tetrazolium. In the past we have had the
impression that the stain is a more reliable discriminator if the
tissue has gone through a freeze-thaw cycle (that may or may not
actually be the case). The tissue can be cut more easily when it
is in a semi frozen state. In the case of rabbit or rat hearts we
bread-loaf the organ into ~3 mm slices simply by eye (we actually
will have a 2mm slice thickness but as you will learn below we
want to cut the tissue somewhat thicker than 2mm). With large
animal hearts we use a meat slicer. Another advantage of the
freeze-thaw procedure is that it puts the tissue into rigor. If
fresh slices are put in triphenyltetrazolium it puts the tissue
into contracture which badly distorts the tissue making it
impossible to get the slices to lay flat for planimetry.
To freeze the tissue we wrap it in a clear
food wrap and put it in a -20ºC freezer (a domestic freezer will
do). 1-2 hrs is ideal. Once the tissue is solid it can be sliced.
The food wrap is very important as it keeps the heart from
freeze-drying. Freeze-dried tissue will always be tetrazolium
negative. If the tissue is left overnight in the freezer it
inceeases the possibility of freeze drying. Freeze dried hearts
can be recognized by a unstained epicardial layer in all slices
and present in both the ischemic as well as non-ischemic zones.
Incubating the slices
The slices are then incubated in the
tetrazolium stain at a temperature of 37ºC. This can be achieved
with a water bath or by simply carefully heating the tetrazolium
cocktail over a hot plate on a low setting and carefully
monitoring the temperature with a thermometer. Once the
temperature has been established add the heart slices and agitate
them at least once a minute. Keep turning the slices any area
constantly touching the bottom or sides of the beaker will not be
stained. We generally incubate for 15-20 minutes. The surviving
tissue should turn a deep red (triphenyltetrazolium) or a dark
blue (nitrobluetetrazolium). Once the color has been established
fix the slice in 10% formalin for ~20 minutes. The living tissue
is colored and the infarcted tissue is a pale tan color. The
formalin step increases the contrast and is especially important
for blood-perfused hearts. The formalin bleaches the tissue and
in particular any extravasated blood. Infarcted tissue is often
hemorrhagic but the blood in the tissue is difficult to
differentiate from the tetrazolium stain. The formaldehyde turns
that blood brown making the infarct much easier to see.
Perfusing hearts with
triphenyltetrazolium
Some investigators prefer to perfuse their
hearts with tetrazolium. The advantage of this method is that the
tissue is stained throughout and not just on the exposed surface.
For small animal models the heart is usually mounted on a
Langendorff system. For large hearts you may want to dissect out
and cannulate the occluded branch at the level of the snare.
37ºC tetrazolium in buffer is then pumped through the heart at
about 0.5ml/gm/min. The stain coming out of the cardiac veins can
be collected and recirculated. After about 15 min of perfusion
the epicardial surface should be a deep red. For large hearts you
should simultaneously cannulate the root of the aorta and infuse
Evens blue dye into it to mark the non-ischemic perfused tissue
at the same time as you infuse the tetrazolium. This yields a
rather striking (and patriotic for many countries including
America, England and Russia) red, white and blue pattern where
red tissue is viable. Blue tissue is the non-risk region and
white tissue is dead. Perfusing a small heart with tetrazolium
will usually put it into contracture which may interfere with any
subsequent perfusions. Thus, it may not be possible to mark the
risk zone after tetrazolium perfusion. This is not a problem when
global ischemia is used and the entire heart constitutes the risk
zone.
Marking the risk zone
When regional ischemia has been employed it
becomes necessary to delineate the field of the occluded artery.
This field is often referred to as the "region at risk"
or the "risk zone" as it is at risk of infarction. The
risk zone is commonly marked by infusing a dye into the coronary
tree while the manipulated branch is occluded. A number of dyes non-toxic, water-soluble dyes
have been used by others. Past
favorite dyes include Evens blue, monastral blue pigment (this is
a colloidal pigment used to tint latex paint and can be purchased
from Sigma, catalog #
25,289-0), India ink, Grass recorder ink, etc. The trick is to
use a concentration of dye that stains the risk zone and not so
much that the risk zone is stained by the small amount of
collateral flow that comes across to it. Usually one simply
watches the epicardial surface and when a good contrast between
the risk zone and the rest of the heart is seen the perfusion is
stopped. Colloidal pigments are the best. We have tried
fluoroscein dye for marking the risk zone. Although the
delineation under black light is very good the dye smears badly
during cutting and handling so that by the end of the procedure
the entire slice is usually fluorescent. Our favorite method for marking
the risk zone has been the use of particulate
markers for visualizing the risk zone as described below.
Our first attempt at particulate staining used radioactive
microspheres. We gave 10,000,000
radio-labeled microspheres into the left ventricle of dogs after
coronary occlusion. After harvesting the heart, it was stained
and sliced. The slices were pressed against X-ray film for 24
hours in a freezer, and then the film developed. The film showed a spot for each microsphere in the tissue and the borders of the perfusion
defect were clearly seen. More recently we perfused the
rabbit heart with fluorescent particles made of zinc/cadmium
sulfate. These 1-10 um particles lodge in the capillaries and are
clearly seen when the heart is illuminated with black light. The
advantage of the particles is that they are invisible under white
light. That allows us to examine the non-risk tissue for
infarction. Technical problems with the perfusion or drug
toxicity can cause infarction outside of the risk zone and if present should be a cause for alarm. Unfortunately, due to
toxicity problems the fluorescent
particles are no longer available.
Fluorescent microspheres sold by Molecular Probes for blood flow studies are not bright enough for this application but
Thermo
Scientific now has a substitute for the particles that is
even better. These are ultra bright polystyrene beads sized from 1 -10 u that
have a specific gravity of 1.06 (much lighter than the particles so they do not
settle out when mixed with saline). We suspended 25 mg of them in 20 ml of 0.9% saline
and injected about 2ml of the suspension per isolated heart. They
show up well under the Woods lamp. The current price is $258/gram which is
enough to stain 400 hearts. Ask for part number 34-1.
Holding the slices
 The
infarct size is determined by measuring the area of infarction in
a series of slices and then multiplying the area times the slice
thickness to determine a volume for that slice. The volumes for
each slice are then summed to calculate the total infarct volume.
The problem is to achieve a precision slice thickness. There are
a number of approaches to this. For small hearts one can stack
razor blades together on a long screw using washers between the
blades to achieve a uniform slice thickness. Although this method
is popular for fixed tissue the fresh heart may be too soft to
cleanly cut with such an apparatus. Cutting the tissue in a semi
frozen state may help. We have taken the approach of simply
cutting the slices by eye with a single edged razor blade (small
hearts) or with a bacon slicer (large animal hearts) and cutting
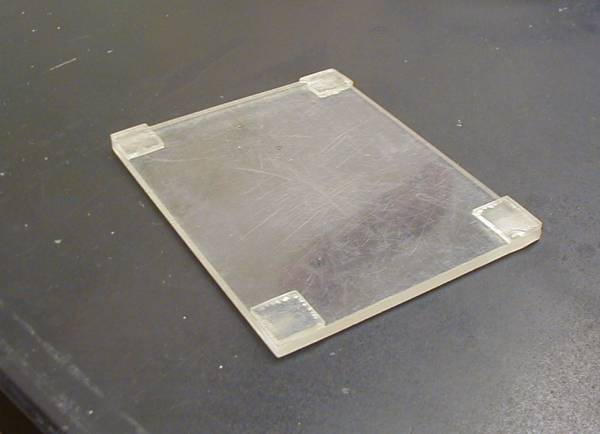
them about 25% thicker than desired. The stained slices are then
placed on a Plexiglas
holder. A cover glass is then
placed over the tissue. Two mm shims in the corners hold the
glass away from the bottom sheet by the desired slice thickness. Spring clamps then
press the glass down against the shims squashing the slices to a uniform 2mm. The tissue
is deformed so that the slices are thinner and the diameter of
the rings is larger. This technique has an added advantage. The
uneven surface of the heart causes it to glisten in the room
light making it difficult to see or photograph the infarct
clearly. By pressing the tissue against the glass cover sheet the
glistening is eliminated and the tissue color can clearly be
seen. The glass also makes a convenient flat surface for directly
tracing the dimensions of the infarct and risk zone on a sheet of
clear acetate.
The
infarct size is determined by measuring the area of infarction in
a series of slices and then multiplying the area times the slice
thickness to determine a volume for that slice. The volumes for
each slice are then summed to calculate the total infarct volume.
The problem is to achieve a precision slice thickness. There are
a number of approaches to this. For small hearts one can stack
razor blades together on a long screw using washers between the
blades to achieve a uniform slice thickness. Although this method
is popular for fixed tissue the fresh heart may be too soft to
cleanly cut with such an apparatus. Cutting the tissue in a semi
frozen state may help. We have taken the approach of simply
cutting the slices by eye with a single edged razor blade (small
hearts) or with a bacon slicer (large animal hearts) and cutting
them about 25% thicker than desired. The stained slices are then
placed on a Plexiglas
holder. A cover glass is then
placed over the tissue. Two mm shims in the corners hold the
glass away from the bottom sheet by the desired slice thickness. Spring clamps then
press the glass down against the shims squashing the slices to a uniform 2mm. The tissue
is deformed so that the slices are thinner and the diameter of
the rings is larger. This technique has an added advantage. The
uneven surface of the heart causes it to glisten in the room
light making it difficult to see or photograph the infarct
clearly. By pressing the tissue against the glass cover sheet the
glistening is eliminated and the tissue color can clearly be
seen. The glass also makes a convenient flat surface for directly
tracing the dimensions of the infarct and risk zone on a sheet of
clear acetate. 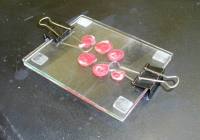
Should I photograph or trace?
Many laboratories like to photograph the
mounted tissue and then trace the infarcts at their leisure when
the films come back. This has a high-tech feel to it and gives a
permanent record. However to get suitable pictures each slice
should occupy a complete field and the lighting and photography must be
superb. For large hearts like those from pigs we like to directly trace the tissue which allows us to
examine the tissue in the best possible state (resolution and
color balance is always degraded in photographs). We then
photograph the tissue for a
permanent record. For smaller hearts macrophotography is preferred.
Planimetry of the infarcts.
Once
the outline of the infarct has been traced it is necessary to
calculate the actual area. This is called planimetry and there
are a number of methods for accomplishing this. The simplest is
to simply cut the tracings out of the sheet of paper (or acetate)
and weigh them on a balance. If the weight/per square centimeter
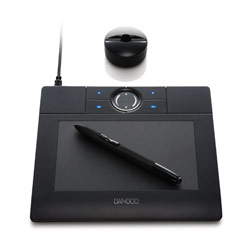
is known then the area can be quickly calculated. Most labs use a computer method. We use a Wacom Bamboo digitizing tablet which connects via a USB port and
costs less than $100 (see picture below). We make tracings of the infarcts
and the risk zones on clear acetate and then trace them them on the tablet with
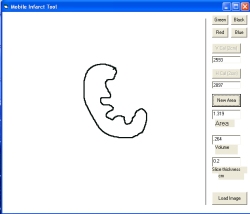
the stylus. We have not found software for calculating areas with the
digitizing tablet and therefore we wrote a simple program in Visual
BASIC to do this. You can download the Mobile
Infarct Tool program in a ZIP format. A screen shot of the Infarct Area
program appears below. Unfortunately, this program only
works on windows-based computers and will not work with a MAC. Be sure to read the Instructions file
in the download which tells how to use the program. For dog or pig hearts the infarct tracings can be
digitized directly. For small hearts we magnify the
tracings 200% on a photocopier. That makes
it easier to accurately measure the areas. Be aware that the area
increases as the square of the magnification. Thus if the image
is magnified by 2 then the calculated areas must be divided by 4
(22) to correct for the magnification. Our plotting
program has a magnification correction routine built into it. The program
will also allow you to load a JPG picture of the heart so the area can be
traced with the mouse.
However if you only want to work from photos we recommend
that you use the ImageJ analysis program which will calculate areas and
does not need the Bamboo tablet. Download ImageJ from https://imagej.nih.gov/ij/.
What is dead and what is alive?
 When you go to the meetings you
see slides showing clear white infarcts on a bright red field.
Those of course were the presentor's best examples.
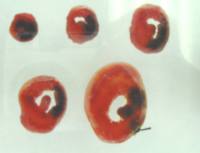
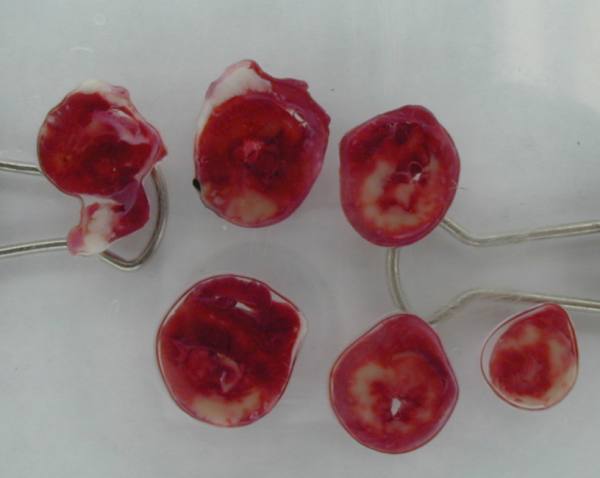
Unfortunately, the real world is not so clear. There is often
pink tissue that is difficult to judge as is seen in figure to the left. Pink tissue may be patchy infarction or may be
normal connective tissue and other structures in the heart. It
can even result from damaging curled slices as you try to get
them to lay flat. We tend to be pretty conservative and include
only the really white tissue. It probably does not make a
difference as long as you are consistent. The subjectivity
factor, however, can be deadly. For example, if the investigator
anticipates a reduced infarct size, he may exclude pink areas
while on other occasions, where a large infarct is anticipated,
he may include anything that is not deep red. Because such
biasing can occur even at the subconscious level, it is
impossible to be completely objective if you are aware of the
treatment when tracing the heart. To get around this we strongly
recommend that a blinded investigator always be used to trace the
infarcts. The specimen should be brought to him for tracing and
he should not be informed of the treatment until after he has
traced the infarcts. Click here for an example of a heart and what we
traced as dead tissue.
When you go to the meetings you
see slides showing clear white infarcts on a bright red field.
Those of course were the presentor's best examples.
Unfortunately, the real world is not so clear. There is often
pink tissue that is difficult to judge as is seen in figure to the left. Pink tissue may be patchy infarction or may be
normal connective tissue and other structures in the heart. It
can even result from damaging curled slices as you try to get
them to lay flat. We tend to be pretty conservative and include
only the really white tissue. It probably does not make a
difference as long as you are consistent. The subjectivity
factor, however, can be deadly. For example, if the investigator
anticipates a reduced infarct size, he may exclude pink areas
while on other occasions, where a large infarct is anticipated,
he may include anything that is not deep red. Because such
biasing can occur even at the subconscious level, it is
impossible to be completely objective if you are aware of the
treatment when tracing the heart. To get around this we strongly
recommend that a blinded investigator always be used to trace the
infarcts. The specimen should be brought to him for tracing and
he should not be informed of the treatment until after he has
traced the infarcts. Click here for an example of a heart and what we
traced as dead tissue.
 In
blood-perfused hearts the infarct is often hemorrhagic. The
extravasated blood is often a dark red color and difficult to
differentiate from tetrazolium stain. For that reason we usually
soak the slices in 10% formalin after tetrazolium staining which
turns the blood a dark brown color. We
wondered if hemorrhagic tissue was always infarcted. To test that
we measured the hemorrhagic area in tetrazolium stained rabbit
hearts. We then bleached the blood with hydrogen peroxide so that
only the tetrazolium staining pattern remained. In every case
100% of the hemorrhagic tissue was tetrazolium negative and thus infarcted.
In
blood-perfused hearts the infarct is often hemorrhagic. The
extravasated blood is often a dark red color and difficult to
differentiate from tetrazolium stain. For that reason we usually
soak the slices in 10% formalin after tetrazolium staining which
turns the blood a dark brown color. We
wondered if hemorrhagic tissue was always infarcted. To test that
we measured the hemorrhagic area in tetrazolium stained rabbit
hearts. We then bleached the blood with hydrogen peroxide so that
only the tetrazolium staining pattern remained. In every case
100% of the hemorrhagic tissue was tetrazolium negative and thus infarcted.
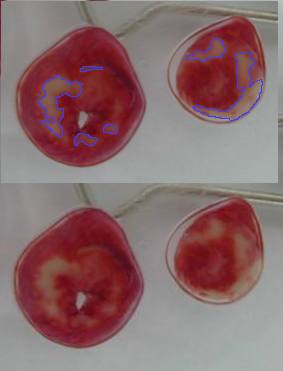
 Working
from Photographs: Using ImageJ
you can usually use the "color threshold" mode to objectively
differentiate infarcted from viable tissue. To the left is a
photograph of a mouse heart cut to 1mm thick slices (click on the picture to
magnify it). It was perfused with Krebs buffer on a langendorff apparatus and
subjected to 35 min global ischemia followed by 2 h reperfusion. The white
rectangle is a 2 cm strip of paper to serve as a scale. Note that we
photographed the slices with a consumer-grade digital camera and a copy stand.
We had to carefully adjust the lights to avoid their reflection on the glass
tissue press. Also we had to cover the camera with some black paper to avoid its
reflection. We used a blue background which makes it easy for ImageJ to
reject. By adjusting the Hue, Saturation and Brightness you can pick out the
pale infarcts as shown on the right panel. Start with Hue 15-42, Saturation
84-255 and Brightness 146-255. You will need to adjust these (depending on your
exposure) until you get a good differentiation of pale to stained tissue.
When the differentiation is adequate click on "select" and the
infarcts will be outlined as in the picture. Once selected you can click on
"anayze" and then "measure" and the number of pixels
encircled will be counted. Use the line tool to measure the length of the 2cm
standard. The length will be in pixel widths. Then you can calculate the actual
area of a pixel and the area of the infarct. The total are of tissue (the risk
zone) can be most easily measured by readjusting the threshold parameters. Using
a blue background I suggest Hue 0-42, Saturation 60-255 and Brightness 31-255.
Once you have a good selection of the entire slice click select and measure. The
Infarct number of pixels divided by the risk zone number of pixels will give you
the % infarction. you can also calculate infarct volume and risk volume as
explained below. You can also use the polygon tool in ImageJ to trace an area of
interest once traced the area can be measured again in pixels.
Working
from Photographs: Using ImageJ
you can usually use the "color threshold" mode to objectively
differentiate infarcted from viable tissue. To the left is a
photograph of a mouse heart cut to 1mm thick slices (click on the picture to
magnify it). It was perfused with Krebs buffer on a langendorff apparatus and
subjected to 35 min global ischemia followed by 2 h reperfusion. The white
rectangle is a 2 cm strip of paper to serve as a scale. Note that we
photographed the slices with a consumer-grade digital camera and a copy stand.
We had to carefully adjust the lights to avoid their reflection on the glass
tissue press. Also we had to cover the camera with some black paper to avoid its
reflection. We used a blue background which makes it easy for ImageJ to
reject. By adjusting the Hue, Saturation and Brightness you can pick out the
pale infarcts as shown on the right panel. Start with Hue 15-42, Saturation
84-255 and Brightness 146-255. You will need to adjust these (depending on your
exposure) until you get a good differentiation of pale to stained tissue.
When the differentiation is adequate click on "select" and the
infarcts will be outlined as in the picture. Once selected you can click on
"anayze" and then "measure" and the number of pixels
encircled will be counted. Use the line tool to measure the length of the 2cm
standard. The length will be in pixel widths. Then you can calculate the actual
area of a pixel and the area of the infarct. The total are of tissue (the risk
zone) can be most easily measured by readjusting the threshold parameters. Using
a blue background I suggest Hue 0-42, Saturation 60-255 and Brightness 31-255.
Once you have a good selection of the entire slice click select and measure. The
Infarct number of pixels divided by the risk zone number of pixels will give you
the % infarction. you can also calculate infarct volume and risk volume as
explained below. You can also use the polygon tool in ImageJ to trace an area of
interest once traced the area can be measured again in pixels.
How should I report infarct sizes?
 The most popular method for
expressing infarct size is as a percentage of the region at risk.
In that case the volume of the infarct for a heart is simply
divided by the volume of the risk zone. For rat or pig hearts
that is probably enough. In the case of the dog many hearts have
extensive collaterals which deliver enough flow during a coronary
occlusion to salvage some tissue. Thus infarct size for each
animal must be plotted against collateral flow for that animal as
shown in this
figure. This gives a remarkably
linear curve with a negative slope. The groups are analyzed
statistically by ANCOVA using % infarction as the dependent
variable, group as the factor and collateral flow for each heart
as a covariate. Because collateral flow must be measured by
microspheres the cost and effort required to measure infarct size
in dogs is considerable. No wonder most laboratories have adopted
the rabbit or rat model.
The most popular method for
expressing infarct size is as a percentage of the region at risk.
In that case the volume of the infarct for a heart is simply
divided by the volume of the risk zone. For rat or pig hearts
that is probably enough. In the case of the dog many hearts have
extensive collaterals which deliver enough flow during a coronary
occlusion to salvage some tissue. Thus infarct size for each
animal must be plotted against collateral flow for that animal as
shown in this
figure. This gives a remarkably
linear curve with a negative slope. The groups are analyzed
statistically by ANCOVA using % infarction as the dependent
variable, group as the factor and collateral flow for each heart
as a covariate. Because collateral flow must be measured by
microspheres the cost and effort required to measure infarct size
in dogs is considerable. No wonder most laboratories have adopted
the rabbit or rat model.
 Rabbits, pigs and rats have
negligible collateral flow and, therefore, collateral flow need
not be measured in these species. In rabbits, however, the fraction of the risk zone that
infarcts varies as a function of the size of the region at
risk. The mechanism for this risk size dependency is not known
but the effect is not trivial. Rabbits do not have a left anterior
descending coronary artery but there is a prominent coronary
branch that courses diagonally over the left anterior aspect of
the ventricle that is easy to snare with a suture. That diagonal
branch supplies from 0.3 to 1.5 cm3 of myocardium in a
rabbit heart. The figure at the left is
from reference 4 and shows the infarct size plotted against the
risk zone size in untreated rabbit hearts subjected to 30 min of
coronary occlusion. Notice that while the plot is reasonably
linear the plot has a definite positive x intercept of about 0.3
cm3 and does not pass through the origin. Notice that
the non-zero intercept was seen if the heart was in situ
or isolated. A remarkably similar non-zero intercept has been
reported by all of the laboratories that use rabbits. Thus,
hearts with small risk zones will show a reduced percentage of
infarction independent of the treatment. We generally exclude all
experiments where the risk zone is below 0.5 since infarct sizes
would have been quite small even in an untreated rabbit. In all
rabbit studies the data should be plotted as in figure 3 and risk
size should be used as a covariate when infarct size is analyzed
by ANCOVA among groups. We have not seen a similar non-zero
intercept in rat hearts.
Rabbits, pigs and rats have
negligible collateral flow and, therefore, collateral flow need
not be measured in these species. In rabbits, however, the fraction of the risk zone that
infarcts varies as a function of the size of the region at
risk. The mechanism for this risk size dependency is not known
but the effect is not trivial. Rabbits do not have a left anterior
descending coronary artery but there is a prominent coronary
branch that courses diagonally over the left anterior aspect of
the ventricle that is easy to snare with a suture. That diagonal
branch supplies from 0.3 to 1.5 cm3 of myocardium in a
rabbit heart. The figure at the left is
from reference 4 and shows the infarct size plotted against the
risk zone size in untreated rabbit hearts subjected to 30 min of
coronary occlusion. Notice that while the plot is reasonably
linear the plot has a definite positive x intercept of about 0.3
cm3 and does not pass through the origin. Notice that
the non-zero intercept was seen if the heart was in situ
or isolated. A remarkably similar non-zero intercept has been
reported by all of the laboratories that use rabbits. Thus,
hearts with small risk zones will show a reduced percentage of
infarction independent of the treatment. We generally exclude all
experiments where the risk zone is below 0.5 since infarct sizes
would have been quite small even in an untreated rabbit. In all
rabbit studies the data should be plotted as in figure 3 and risk
size should be used as a covariate when infarct size is analyzed
by ANCOVA among groups. We have not seen a similar non-zero
intercept in rat hearts.
Useful References
validating the tetrazolium method
1. Nachlas,M., Schnitka,T Macroscopic
identification of early myocardial infarcts by alterations in
dehydrogenase activity. Am.J.Pathol.;42:379-406, 1963
2. Fishbein MC, Meerbaum S, Rit J, Londo U,
Kanmatsuse K, Mercier JC, Corday E, Ganz W, Early phase acute
myocardial infarct size quantification: validation of the
triphenyl tetrazolium chloride tissue enzyme staining technique.
Am Heart J;101:593-600, 1981
3. Klein HH, Puschmann S, Schaper J,
Schaper W, The mechanism of the tetrazolium reaction in
identifying experimental myocardial infarction. Virchows Arch
;393:287-297, 1981
4. Ytrehus K, Liu Y, Tsuchida A, Miura T,
Liu GS, Yang X, Herbert D, Cohen MV, Downey JM. Rat and rabbit
heart infarction: effects of anesthesia, perfusate, risk zone,
and method of infarct sizing. Am J Physiol ;267:H2383-H2390, 1994
Return to the
HELP Table of contents
 The
infarct size is determined by measuring the area of infarction in
a series of slices and then multiplying the area times the slice
thickness to determine a volume for that slice. The volumes for
each slice are then summed to calculate the total infarct volume.
The problem is to achieve a precision slice thickness. There are
a number of approaches to this. For small hearts one can stack
razor blades together on a long screw using washers between the
blades to achieve a uniform slice thickness. Although this method
is popular for fixed tissue the fresh heart may be too soft to
cleanly cut with such an apparatus. Cutting the tissue in a semi
frozen state may help. We have taken the approach of simply
cutting the slices by eye with a single edged razor blade (small
hearts) or with a bacon slicer (large animal hearts) and cutting
them about 25% thicker than desired. The stained slices are then
placed on a Plexiglas
holder. A cover glass is then
placed over the tissue. Two mm shims in the corners hold the
glass away from the bottom sheet by the desired slice thickness. Spring clamps then
press the glass down against the shims squashing the slices to a uniform 2mm. The tissue
is deformed so that the slices are thinner and the diameter of
the rings is larger. This technique has an added advantage. The
uneven surface of the heart causes it to glisten in the room
light making it difficult to see or photograph the infarct
clearly. By pressing the tissue against the glass cover sheet the
glistening is eliminated and the tissue color can clearly be
seen. The glass also makes a convenient flat surface for directly
tracing the dimensions of the infarct and risk zone on a sheet of
clear acetate.
The
infarct size is determined by measuring the area of infarction in
a series of slices and then multiplying the area times the slice
thickness to determine a volume for that slice. The volumes for
each slice are then summed to calculate the total infarct volume.
The problem is to achieve a precision slice thickness. There are
a number of approaches to this. For small hearts one can stack
razor blades together on a long screw using washers between the
blades to achieve a uniform slice thickness. Although this method
is popular for fixed tissue the fresh heart may be too soft to
cleanly cut with such an apparatus. Cutting the tissue in a semi
frozen state may help. We have taken the approach of simply
cutting the slices by eye with a single edged razor blade (small
hearts) or with a bacon slicer (large animal hearts) and cutting
them about 25% thicker than desired. The stained slices are then
placed on a Plexiglas
holder. A cover glass is then
placed over the tissue. Two mm shims in the corners hold the
glass away from the bottom sheet by the desired slice thickness. Spring clamps then
press the glass down against the shims squashing the slices to a uniform 2mm. The tissue
is deformed so that the slices are thinner and the diameter of
the rings is larger. This technique has an added advantage. The
uneven surface of the heart causes it to glisten in the room
light making it difficult to see or photograph the infarct
clearly. By pressing the tissue against the glass cover sheet the
glistening is eliminated and the tissue color can clearly be
seen. The glass also makes a convenient flat surface for directly
tracing the dimensions of the infarct and risk zone on a sheet of
clear acetate. 


