

SABRE Cuts September 2021 Commentary by Dr. Reid Cummings
Posted on September 30, 2021 by Dr. Reid Cummings
Greetings and welcome to the September 2021 edition of SABRE Cuts. This month we ask our readers: What is Data Visualization and Why Should You Care?
Technological advancements in the 21st century have enabled even the smallest businesses to start generating data—oceans of it. Every swipe, click, scan, or display touch generates data, and billions of people swipe, click, scan, and touch screens everyday around the globe. The amount of company-generated data can become enormous. Unfortunately, data can lose value because business leaders are often so overwhelmed with managing the data that they spend little time interpreting and explaining correctly what the data mean, not just today, but in the future. A clear question then becomes: is there a process that businesses can use to maximize efforts to do so?
Data visualization is a process that helps presenters prepare data interpretation for wide audiences, and that helps users make better sense of what the data are saying. This is why as a field data visualization has become so important, because it allows decision-makers to see and understand their data in ways that traditional spreadsheets cannot. The best data visualizations accomplish two goals: 1) it shortens dramatically the amount of time it takes to interpret the data, and 2) it minimizes data interpretation errors.
Data visualization involves multiple complex steps, but an aspect worth pointing out is what is known as “preattentive attributes.” Simply put, preattentive attributes are visual features of an object that the human eye and the brain process in a fraction of a second. For example, the color, size, or orientation of an object are all considered preattentive attributes. If applied strategically, these visual cues catch one’s attention instantly, or preattentively.
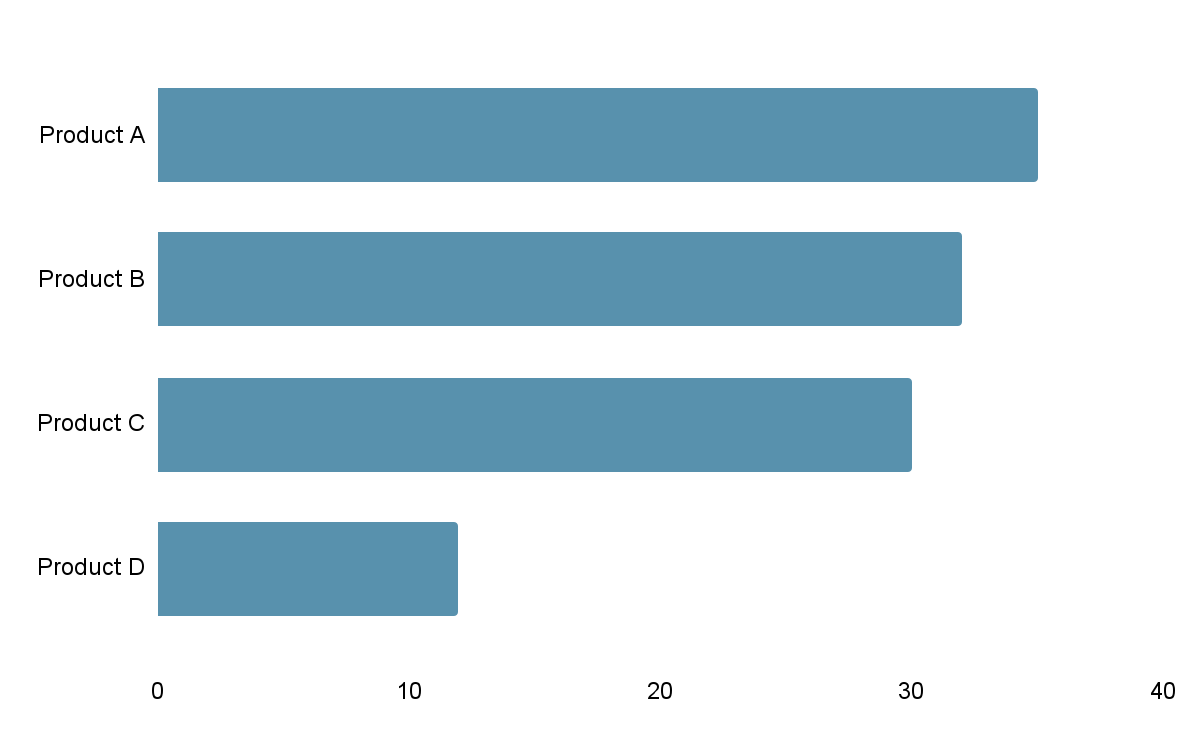
Consider an example. Assume an analyst wants to convey how successful sales of a product are relative to others, say, Product A versus Products B, C. or D.
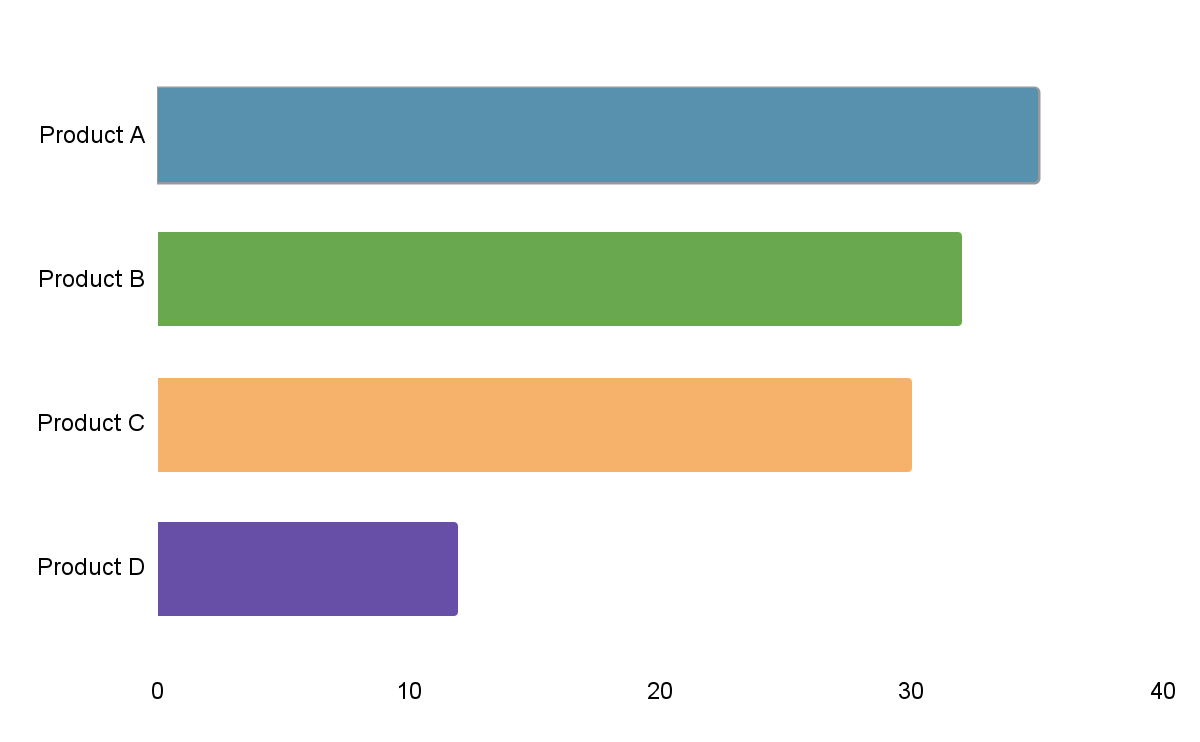
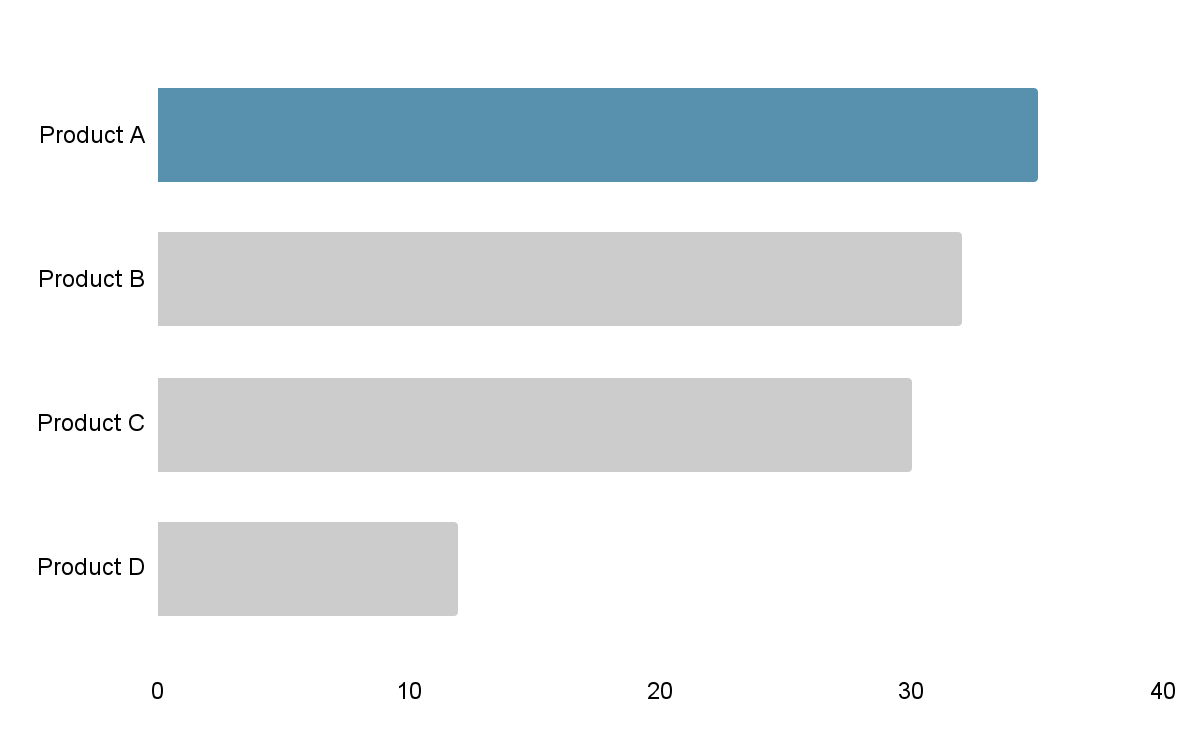
The two bar charts both use color as a preattentive attribute but only the one on the right uses color strategically. It highlights the leading product in blue, immediately drawing attention while relegating the others to the background using grey. The charts also use size, or bar length, as a strategic preattentive attribute by sorting the bars in descending order, thus making it effortless to see which product leads the sales, which one is the second, and so on.
Consider another example.
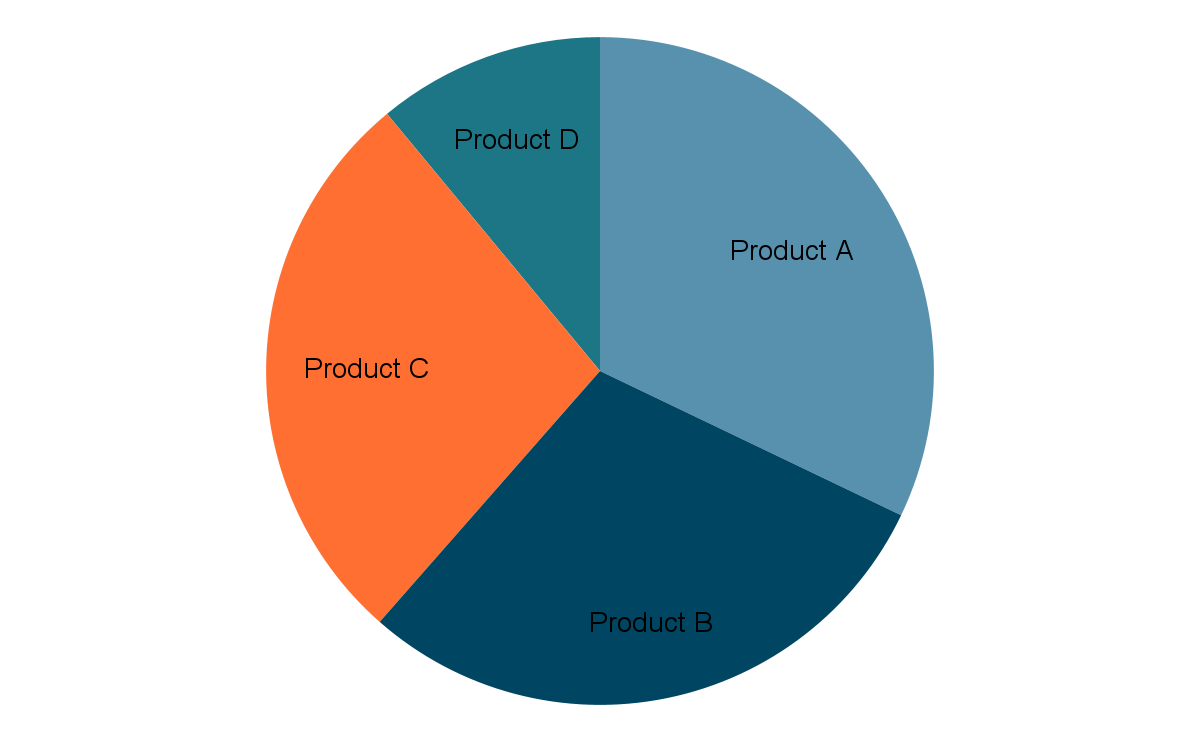
Both charts use size and orientation as preattentive attributes. Because multiple pie slices appear similar in size, it is difficult to make comparisons. On the other hand, the bar chart’s orientation and sorting, as well as the length of the bars make it effortless to see the leading product and compare it to the others.
These simple examples illustrate how powerful data visualization can be as an analysis and presentation technique. But to be sure, data visualization is only part of the data analytics puzzle. For businesses, using business analytics to steer policy and direction is an increasingly critical component in an environment in which speed and accuracy matter. Whether a business is large or small does not matter because at any level, data driven decisions are far superior to those based simply on assumptions. This is why being able to capture, model, analyze, interpret, and present data is so important.
We host an entire session on best practices in data visualization at the SABRE Analytics Summit on November 18, 2021. We hope you can join us for that and more. In the meantime, feel free to visit our website for updated dashboards.
Until next time, from everyone at SABRE, we wish you and yours all the best.